
As you develop your plan goals, you may want to go a step further and develop a funding ask as well. Considering developing an evidenced-based cost argument. If the vision set out in the plan were to be realised, what would the impact be? This will help you build a solid business case to funders and government, but will also help you distil your goals.
Your research and consultation may have told you new housing and supports were needed, but how much of what program/housing? How much would this cost and to what effect? These are basic questions decision makers will ask, but so too will the public. Releasing a youth plan without an indication of the resources required to execute it will pose a legitimacy risk. You may be able to mitigate this by noting you will work on such questions in implementation, but there is no reason why you can’t consider including this piece of analysis during plan development.
Though other plans make it look easy, with infographics and simple dollar figures, the analysis that goes behind such business cases is no easy feat.
Here is what you need to know to get started:
First, know your limits. You and/or your team may not have the technical background to develop the necessary analysis. You may need to bring in an external expert, while making sure they walk you through the methods so you can learn for future needs. You may also not have the necessary data to complete the modelling – in such a case, you may want to suggest such analysis is done during plan implementation.
Know however, that without a solid articulation of the impact that the proposed measures will have and the cost of these, it is going to be more difficult to credibly approach decision makers to support and invest in the plan. Budgeting and impact assessment, along with scenario building, are to a large degree interconnected and are in many ways different ways of interpreting the same information, building on one another as you go.
1. Prevalence of homelessness & youth homelessness in your community
First, figure out local homelessness prevalence rates and calculate the youth prevalence from this general figure. The prevalence rate refers to the total number of sheltered and unsheltered homelessness person in your community during the course of one year. Cities usually represent this rate as a percentage of their general population – in Calgary, it is 1.4% and in Red Deer it is 0.8%.
Note that you are estimating the number of rough sleepers who would otherwise not be captured at any point during the year in the shelter data used. Ensure you account for possible duplication among diverse facilities as well.
You will also have to estimate how many of these individuals are youth (up to 24 years old). It is best to use actual shelter and rough sleeper demographics from your HMIS or HIFIS for this and if these are unavailable at least general population demographics to generate an estimate.
Below is an example of what the results of this exercise can look like.
Table 26: Estimating Youth Homelessness
2. Estimate of the at-risk population
Calculate an estimate of the total number of youth at risk of homelessness in your community. You can do this through an analysis of extreme core housing need using Census data to determine the number of individuals renting and paying more than 50% of income on shelter with low incomes (under $20,000). Break this figure out by age groups to gain a sense of the youth component.
You may also be able to complement this data with available information from public systems on youth discharges into homelessness from corrections, child protection, health, treatment, etc.
Note that because Census data is dated (2011), you will need to project current totals based on historic population growth. You can also estimate the total number of individuals from the household data by looking at census information on average household size. In this example, it was 2.3 individuals per household.
Table 27: Estimating Youth At Risk Population
3. Homelessness type and acuity among at-risk groups estimates
Using the available data, you can develop an analysis of the at-risk and homeless youth population to estimate the breakout of level of acuity.
You can use HMIS or HIFIS information to generate this estimated acuity breakout based on the most recent annual data or provide a placeholder until you have actual data from community input and service provider reports. Ensure you project population growth for the entire implementation time period to ensure adequate resources are allocated.
Looking at both calculations, we can see that we have a total of about 1,242 youth at risk of experiencing homelessness and/or who experience transitional homelessness and 53 youth who use shelters or sleep rough for a total of 1,295 total youth who may need an intervention by 2018.
Table 28: Projecting Needs
After we split out the acuity levels by homeless/at-risk groups, we have a good sense of what capacity would be needed to serve projected demand by 2018. The estimated need gives you a sense of what kind of interventions will be needed to match demand to program types.
Table 29: Estimating Need Levels
4. System capacity and performance analysis
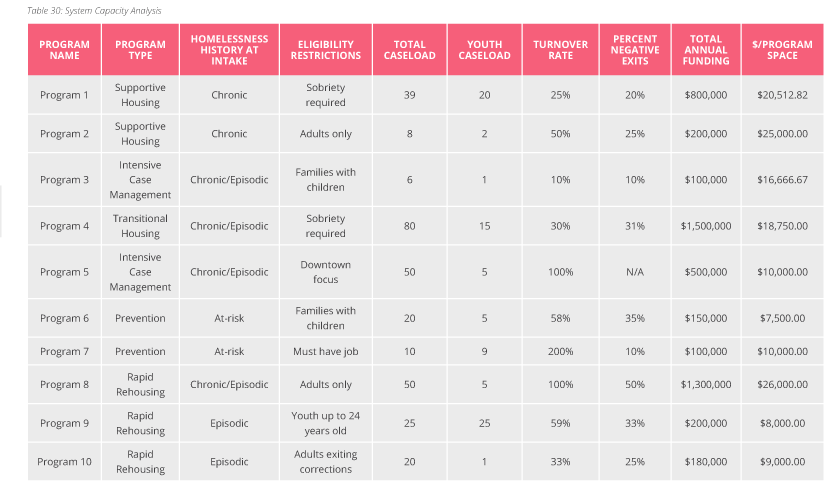
Provide a breakdown of current homeless services and housing youth access per program type or specifically target youth and their most current performance indicators where possible. This includes such indicators as turnover rates annually, caseload capacities, bed/unit inventory, negative exits, length of stay and cost per program/housing space. Note any eligibility requirements that have an impact on youth.
To classify programs, you can use local definitions, or look to the Performance Management Toolkit for consistent definitions and benchmark indicators of performance. The turnover rate reflects how many new clients in any given year went through the program as a percentage of the total caseload capacity of the program. Negative exits represent total clients who exited to homelessness (rough sleeping, shelter, jail, etc.) as a percent of total exits in a particular year. The program space cost is calculated by dividing the annual funding by the total caseload.
In the example below, you can see, by comparing the youth caseload to the total caseload, not all programs serve youth exclusively. In fact, average caseload for youth of all programs is 29%. You will need to consider if this level of access is proportional to the estimated need, but try to dig even deeper to determine how outcomes for youth compare to those of adults. Are there subgroups of youth (Indigenous, immigrants, etc.) that differ in access and outcomes? How does this play out from a cost analysis perspective?
Table 30: System Capacity Analysis
Click here to enlarge table (Download PDF)
5. Modelling solutions
Based on the previous steps, you will need to evaluate what type of interventions are best suited to ending homelessness in your community in your particular timeframe (ex. Two, five, 10 years), as well as the associated costs and capacity needs.
Surprisingly, you may find that you have adequate capacity to meet the needs of certain groups, but have performance issues that need addressing in other areas. Without this analysis, you are likely to make overly generalized recommendations, without a solid sense of cost and impact.
From the example below, you can see there will be a total of 113 youth served by 2018 if the system continues as is. We know higher acuity youth with longer homelessness histories will likely benefit from supportive housing and intensive case management (ICM). Conversely, youth who experience transitional homelessness or are at-risk of homelessness are more likely to benefit from rapid rehousing and prevention services. As a result, we can estimate that lower acuity youth at-risk/experiencing transitional homelessness will remain underserved with the current performance and capacity in the system.
By playing with the numbers, we can estimate what it would take to eliminate youth homelessness in terms of new program capacity, but also what impact enhanced performance might have on turnover and negative exits. The turnover in the model, for instance, assumes that current negative exits and turnover rates remain consistent, but what if these improved? We can model what impact enhanced performance would have. Improvements to service quality or access for youth would likely not require the same level of funding.
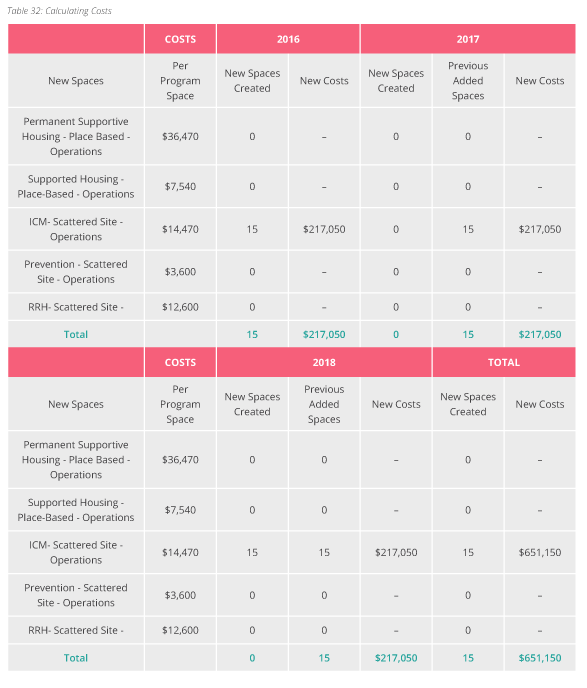
Once you work out some scenarios, you can also model costs for maximum impact. Capital solutions will likely be the costliest, though may be critical for particular groups of youth. You can also play with program costs to potentially create efficiencies in some cases. In the scenario below, new ICM spaces are modelled to estimate the costs of the enhancement over the set time period. This can be done with all program types, depending on need.
Table 31: Estimating Impact
Click here to enlarge table (Download PDF)
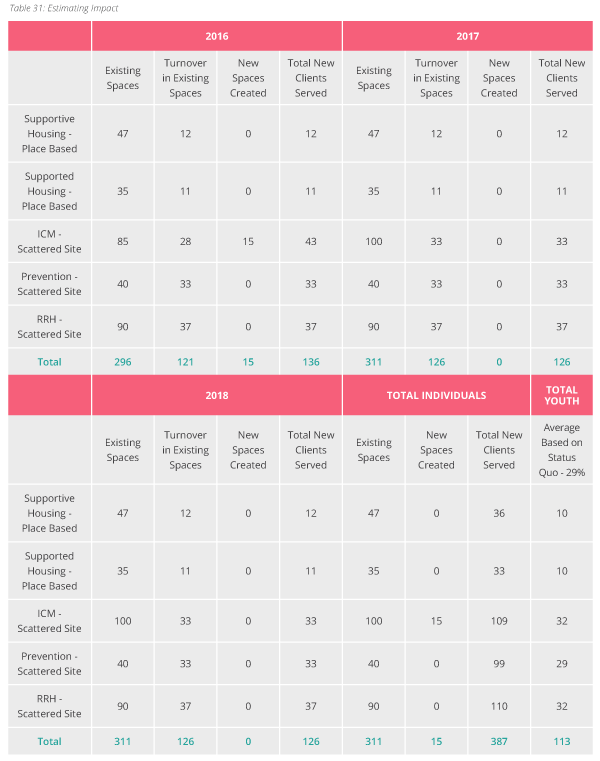
Table 32: Calculating Costs
Click here to enlarge table (Download PDF)
Once you’ve completed the analysis, develop a summary with a proposed course of action but also outline at least three scenarios for the consideration of the broader planning group. Ensure you provide a full assessment of risks and record all your assumptions so future work can build on your calculations in implementation. On the next page is a sample risk register from Calgary’s Plan to End Homelessness.
6. Developing your funding ask
Ensure you are explicit about the costs of new operations and capital over the course of the plan’s implementation – see example below.
Table 33: Developing Funding Asks
Ideally, you will be able to outline who is expected to cover these costs – in other words, what is the ask to various government and community funders?
A solid case to funders can be made by showing the cost savings realized through implementing the plan. Unfortunately, we do not have good data at this time to develop this analysis with a youth focus. For examples for how this can be undertaken for broader populations, the Chez Soi project and several community plans are available for review such as Calgary’s plan, though these are not specifically targeted at youth.